R Language Programming

R offers a wide variety of statistics-related libraries and provides a favorable environment for statistical computing and design. In addition, the R programming language gets used by many quantitative analysts as a programming tool since it's useful for data importing and cleaning.

R programming is designed for Data Analysis!

R is primary a data analysis software that consists of vast collection of algorithms for data retrieval, processing, analysis and high-end statistical graphics. R has the built-in universal statistical methods such as mean, median, distributions, covariance, regression, non-linear mixed effects, GLM, GAM and the list just goes on… The functions of R programming language can access all the areas of the analysis results and combine analytical methods to reach certain conclusions which are crucial for the organizations.
  • rpmlImaage
  • rpmlImaage
  • R language produces high-end graphics!

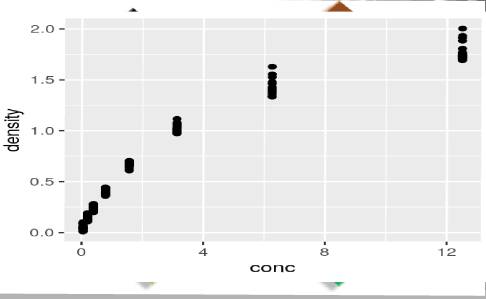
    R programming as a flexible graphical environment to offer a wide variety of graphical functions for data presentations such as bar plots, pie charts, histograms, time series, dot charts, image plots, 3D surfaces, scatter plots, maps, etc. Using R, you can customize your graphics endlessly, and develop fresh graphics by combining different graph types and have great FUN!